Poor data quality costs pharmaceutical manufacturers millions each year in batch rejections, compliance issues, and lost productivity. Our engineering team regularly sees companies struggle with data integrity during FDA audits, often because they lack clear methods into how to measure data quality and how to track it as well.
1. Why Pharmaceutical Manufacturers Need Data Quality Metrics
Every pharmaceutical manufacturer knows the drill: the FDA shows up for an audit, and suddenly everyone is scrambling to prove their data is accurate and complete. But waiting for an audit to check your data quality is like waiting for a failed batch to check your equipment calibration – it’s too late and too costly.
From our work with leading pharmaceutical companies, we’ve found that proactive data quality measurement helps you:
- Catch documentation errors before they lead to batch rejections
- Build confidence in your manufacturing data for faster decision-making
- Reduce investigation time for deviations
- Support continuous improvement initiatives with reliable metrics
2. The Real Cost of Poor Data Quality
Let’s talk numbers. One of our clients, a mid-sized pharmaceutical manufacturer, was losing an average of 3-4 batches per month to documentation errors. Each rejected batch cost them roughly $50,000 in materials alone. After implementing proper data quality monitoring systems, they cut their rejection rate by 75%.
3. How to Measure Data Quality Metrics for Pharmaceutical Manufacturing Facility
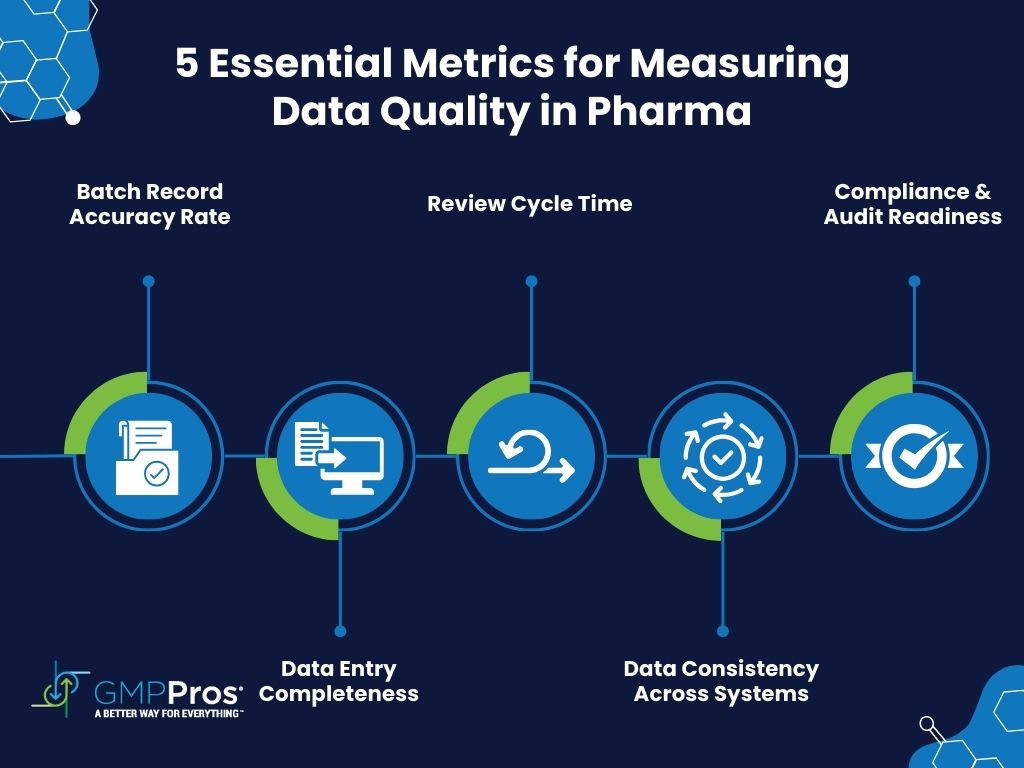
Quality data directly impacts your bottom line. Drawing from our experience with leading pharmaceutical manufacturers, we’ve identified four critical metrics that consistently drive improvements in manufacturing efficiency and compliance. Let’s break down each one with real-world applications.
3.1. Batch Record Accuracy Rate
This metric forms the backbone of your data quality program. It measures how often your batch records are right the first time, without requiring corrections.
- Accuracy = (Clean Batch Records / Total Batch Records) × 100
- Target: 95% or higher
Real-World Example
A mid-sized pharmaceutical client tracked their batch record accuracy over six months:
| Month | Total Records | Clean Records | Accuracy Rate | Common Issues |
| January | 120 | 98 | 81.7% | Missing signatures |
| February | 115 | 102 | 88.7% | Calculation errors |
| March | 125 | 110 | 88.0% | Incomplete sections |
| April | 118 | 108 | 91.5% | Time gaps |
| May | 122 | 115 | 94.3% | Minor corrections |
| June | 124 | 119 | 96.0% | Minimal issues |
After implementing electronic batch records, they achieved consistent accuracy above 95%. Key improvements included:
- Automated calculations eliminating math errors
- Required field completion preventing missing data
- Digital timestamps reducing time entry issues
- Electronic signatures streamlining approvals
3.2. Data Entry Completeness
This metric ensures your batch records contain all required information. It’s particularly crucial for maintaining compliance with manufacturing best practices.
- Completeness = (Completed Required Fields / Total Required Fields) × 100
- Target: 98% or higher
Critical Fields to Monitor
- Process Parameters
- Temperature readings
- Pressure measurements
- pH values
- Mixing times
- Quality Checks
- In-process controls
- Environmental monitoring
- Equipment cleaning verification
- Material verification
- Personnel Data
- Operator identification
- Reviewer signatures
- Training verification
Implementation Tips
- Create standardized checklists for each product
- Use color-coding in your batch manufacturing record system to highlight missing data
- Implement real-time completeness checks during data entry
- Generate daily incomplete entry reports
3.3. Review Cycle Time
This metric tracks the efficiency of your batch release process. Faster review cycles mean quicker time to market while maintaining quality standards.
- Average Time = Total Review Hours / Number of Batches
- Industry benchmark: 24-48 hours
Review Cycle Breakdown
Typical time allocation for a well-optimized review process:
| Review Stage | Target Time | Activities |
| Initial QA Review | 8-12 hours | Data verification, compliance check |
| Manufacturing Review | 4-6 hours | Process parameter verification |
| Laboratory Review | 6-8 hours | Test results confirmation |
| Final QA Approval | 4-6 hours | Final compliance verification |
To improve your review cycle time, consider implementing these process improvement strategies:
- Parallel review workflows
- Risk-based review approaches
- Automated data verification
- Real-time review capabilities

3.4. Data Consistency Across Systems
This metric ensures your data tells the same story across all your systems, critical for maintaining efficient operations.
- Consistency = (Matching Values / Total Compared Values) × 100
- Target: 100%
Key System Integration Points
- MES to LIMS Integration
- In-process test results
- Release testing data
- Material specifications
- Equipment status
- ERP to MES Integration
- Material consumption
- Batch yields
- Production schedules
- Resource allocation
Consistency Monitoring Framework
| Data Type | Check Frequency | Tolerance | Action if Mismatch |
| Critical Process Parameters | Real-time | ±0% | Immediate investigation |
| Batch Yields | Daily | ±1% | Review within 24 hours |
| Material Usage | Per batch | ±2% | Review before batch release |
| Test Results | Per test | ±0% | Immediate investigation |
Implementation Strategy
- Start with critical quality attributes
- Expand to key performance indicators
- Include all GMP-relevant data
- Implement automated data quality monitoring
4. Taking Action on Your Metrics
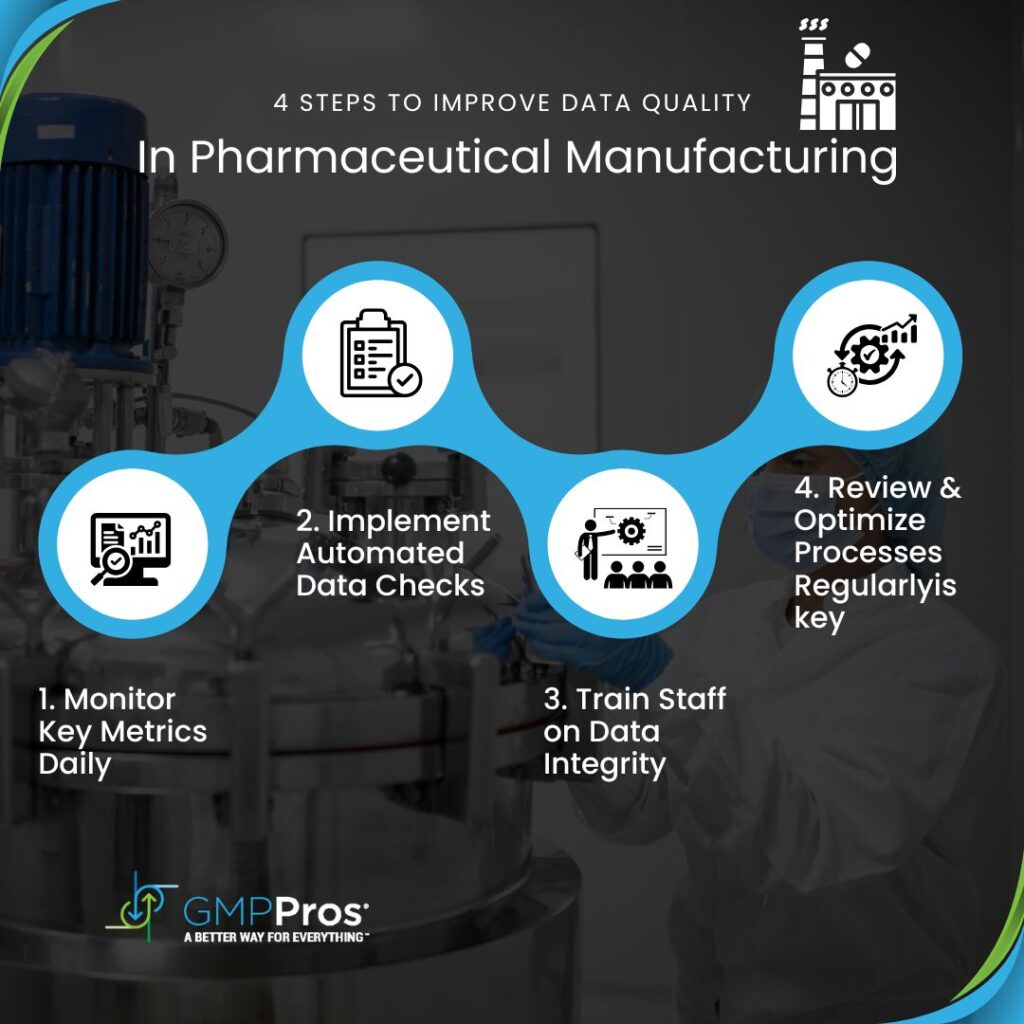
Simply measuring isn’t enough – you need to act on the data. Here’s a practical approach:
- Daily Monitoring
- Review completeness scores
- Check for accuracy issues
- Monitor review cycle progress
- Verify system consistency
- Weekly Analysis
- Trend review of all metrics
- Team performance evaluation
- System performance check
- Resource allocation review
- Monthly Reporting
- Compliance status review
- Performance against targets
- Improvement initiatives tracking
- Training needs assessment
- Quarterly Assessment
- Trend analysis
- Target adjustment
- System optimization
- Process improvement planning
By focusing on these four essential metrics and following a structured monitoring approach, you’ll build a robust foundation for data quality in your pharmaceutical manufacturing operation. Need help implementing these metrics or optimizing your current system? Our team specializes in pharmaceutical data quality solutions. Contact us to discuss your specific needs.
5. Making These Metrics Work in Your Facility
Here’s what successful implementation looks like, based on our experience helping pharmaceutical manufacturers improve their manufacturing efficiency:
- Start Small Focus on one critical process or product line. We typically recommend beginning with your highest-volume products where data issues would have the biggest impact.
- Build Your Baseline Gather at least 3 months of data to understand your current performance. This helps identify normal variations versus actual problems.
- Set Realistic Targets Don’t aim for perfection immediately. If your current batch record accuracy is 70%, aim for 80% in the first quarter, then gradually increase your targets.
Need help setting up these metrics in your facility? Our data science team can evaluate your current systems and implement automated monitoring solutions tailored to your needs.
6. Common Pitfalls to Avoid
Through our work implementing best practices in manufacturing, we’ve seen several common mistakes:
- Collecting too many metrics at once
- Not training operators on why data quality matters
- Focusing on punitive measures instead of improvement
- Ignoring system limitations that make good data entry difficult

7. Real-World Success Story
A recent project with a generic pharmaceutical manufacturer illustrates the power of good data quality metrics. They were struggling with long batch release times, averaging 7-10 days per batch. Learning how to measure data quality improves manufacturing processes, it reduces release time to 3 days while maintaining compliance.
Next Steps for Your Facility
- Review your current batch record process
- Identify your biggest data quality pain points
- Pick 2-3 metrics from this guide to start measuring
- Set baseline targets
- Train your team on proper data entry and verification
Remember, good data quality isn’t just about passing audits – it’s about building a foundation for efficient production and consistent quality. Start with these basics, and you’ll be ahead of most pharmaceutical manufacturers in terms of data integrity and compliance. Want to learn How to measure data quality & implement these metrics in your facility? Our team of pharmaceutical manufacturing experts can help you develop a customized data quality program. Contact us to discuss your specific needs.

